Written by: Sanju Subnani
“M” is for Mainstream
The mainstream method of investing in publicly traded stocks and bonds is simple. In theory, the investor becomes an owner of the company’s debt or equity and therefore has a claim on company profits. Bondholders are paid before stockholders. Stockholders would receive the remainder of the company’s residual profit if any while undergoing Chapter 11 of the Bankruptcy Code. The above assumptions form the foundation of Modern Portfolio Theory. Modern portfolio theory practitioners attempt to diversify risk and allocate investment funds via sector rotation or some percentage split of stocks and bonds.[1] Subnani Investment Research, LLC’s February 6, 2020 article titled “The Shareholder Ownership Myth” formed a counterargument against modern portfolio theory. The article stated the foundation on which modern portfolio theory stands is baseless. Stock and bondholders do not own a piece of the company. Stock and bondholders do not control the company’s day-to-day operations and therefore are not owners according to bankruptcy law.[2] The firm further solidified its point in the case study article posted on December 8, 2020, titled “Case Study: Pacific Gas & Electric (NYSE: PCG) Stock Report.” In summary, the article pointed to the fact that if the foundation modern portfolio theory stood on was firm, then Pacific Gas and Electric common stock would be worthless at the conclusion of the company’s Chapter 11 Bankruptcy Reorganization proceedings in 2020. However, the common stockholders were kept liquid as the bankruptcy court failed to identify a residual owner, as one does not exist.[3]
Risky Biscuits
Subnani Investment Research LLC’s investment philosophy is centered behind the assertion that an investor is purely a holder of risk, not the holder of an asset. The value of that risk, or the price an investor pays for a stock or bond, is sensitive to changes in interest rates and taxes. The firm believes there is no such thing as a stock or bond allocation. The firm believes the value of stocks, bonds, alternative currencies, and real estate is directly tied to the credit or interest rate cycle.[4] When an investor decides to buy a stock, bond, or alternative currency, the investor is simultaneously taking a bet that the value of the US dollar and interest rates will go down. When an investor sells out of a stock, bond, or alternative currency, the investor is betting the value of the US dollar and interest rates will go up. The reason why investors shift from dollars to other assets is that dollars are not earning enough yield. Higher yields are to be found in stocks, bonds, and real estate, so capital flows in that direction.[5] When interest rates trend lower, the reason for being bullish stocks becomes stronger and stock prices continue rising. When interest rates trend higher, the bullish case for stocks begins to weaken, investors begin to sell stocks, move back into dollars, and stock prices fall. The table below breaks down the exposure an investor has when they buy or sell a stock, bond, or alternative currency.
Subnani Investment Research LLC’s Investment Perspective
When an investor buys a stock, bond, alternative currency, the investor is:
↓ Short Dollar, Short Interest Rates ↓
When an investor sells out of a stock, bond, alternative currency, the investor is:
↑ Long Dollar, Long Interest Rates ↑
The firm asserts the value of an investor’s risk, whether held in the form of stocks, bonds, Dogecoin, or another alternative currency is dictated by the direction of interest rates. Monetary policy is the Federal Reserve’s toolset used to artificially control interest rates. Since the mid-1980s, interest rates have trended lower as a result of aggressive interest rate cuts by the Federal Reserve after the hyperinflation mania of the 1970s.[6] The chart below is from 1980 to May 2021 and includes the 10-year interest rate (TNX – blue line) and the S&P 500 price (red line). The chart highlights how 40 years of aggressive interest rate cuts have made owning stocks or the short dollar, short interest rate trade gain in value substantially.

Interwoven throughout the most recent 40 years of aggressive rate-cutting were periods in which the stocks or the short interest rate, short dollar trade saw losses. These instances included Black Monday on October 19, 1987, in which the S&P 500 fell approximately 20% in one trading day, the Dotcom bubble pop in 2000-2001, and the Mortgage bubble pop in 2008-2009. The firm believes the short dollar, short interest rate trade is due for an abrupt halt and will experience losses in 2021 as a result of the Federal Reserve allowing interest rates to rise, or monetary tightening.
“Is it a Clockwise Swirl, Jerry?”
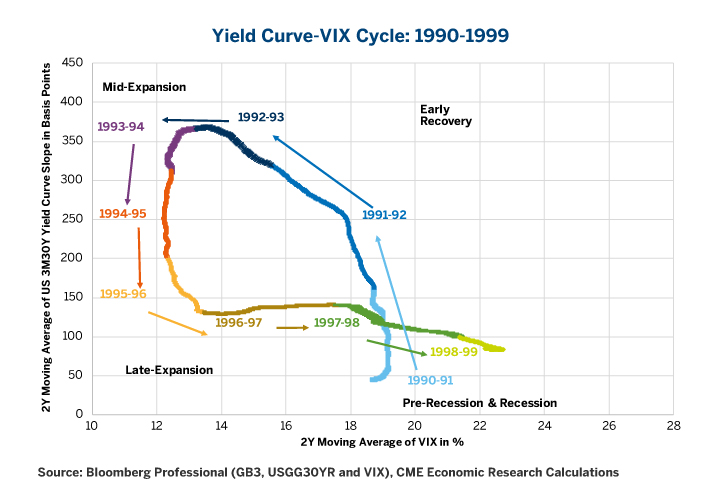
In 1993, the introduction of the Volatility Index (VIX) by the Chicago Board Options Exchange (CBOT) provided investors a way to gauge market sentiment that was defined to a number. The VIX index measures the implied volatility of S&P 500 options.[7] When the S&P 500 falls, investors seek insurance by buying S&P 500 put options causing the price of the VIX to rise. When the S&P 500 rises, investors seek income by selling S&P 500 put options causing the price of the VIX to fall. The daily candlestick price action of the VIX is extremely choppy and rather useless to observe on its own. However, when a 2 year (500-day business day) moving average of interest rates (30-year minus 3-month yield curve) and a 2-year moving average of the VIX is smoothed out and arranged on an “X to Y” scatterplot the result is an incredibly powerful financial chart, called the “Yield Curve-VIX Cycle.” The chart pattern is an impressive, consistent counterclockwise motion.[8]
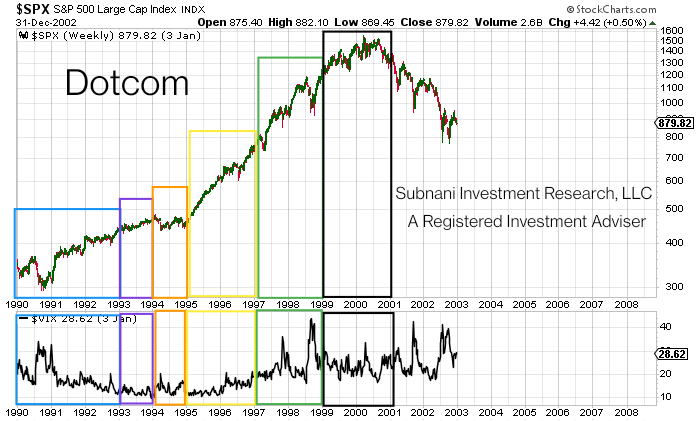
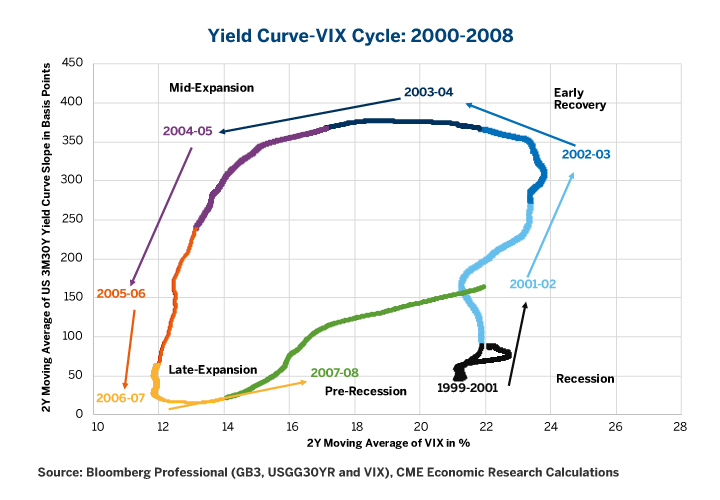
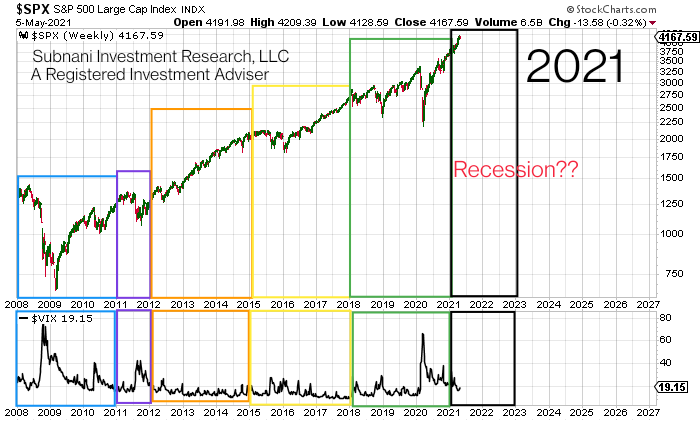
Although just as important, the “swirl” the firm will be referring to is not related to “The Move” Jerry was trying to teach George in ‘Seinfeld.’[9] The most impressive fact regarding the Yield-Curve VIX Cycle swirl is that it encompasses the interplay of Federal Reserve policy in response to economic downturns. If there was a swirl that was more important than “The Move” it would be the Yield-Curve VIX Cycle. The cycle is broken down into four phases: Pre-Recession & Recession, Early-stage Recovery, Mid-stage Expansion, and Late-stage Expansion. Below are the Yield-Curve VIX Cycle swirls from Dotcom 2000, Mortgage Bubble 2008, and 2021 as well as an accompanying price chart highlighting the four separate phases. The price chart includes the VIX in the bottom subgraph. Each price chart starts with the early-stage recovery boxed in light blue, mid-stage expansion boxed in purple, late-stage expansion boxed in orange + yellow, pre-recession boxed in green, and recession boxed in black. During early-stage recovery, the yield curve remains steep and equity volatility (VIX) begins to fall. During the mid-stage expansion, the yield curve starts to flatten and the VIX remains low. During late-stage expansion, the yield curve becomes even flatter and equity volatility soars as fears of a recession dominate investor behavior. During the early recession and recession phase, the yield curve moves from flat to upward sloping (steep) and the VIX is relatively high.[10]
Dotcom Yield Curve-VIX Cycle
Dotcom Price Chart with boxed Cycles + VIX bottom subgraph
Mortgage 2008 Yield Curve-VIX Cycle
Mortgage 2008 Price Chart with boxed Cycles + VIX bottom subgraph

Current Yield Curve-VIX Cycle

Current Price Chart with boxed Cycles + VIX bottom subgraph
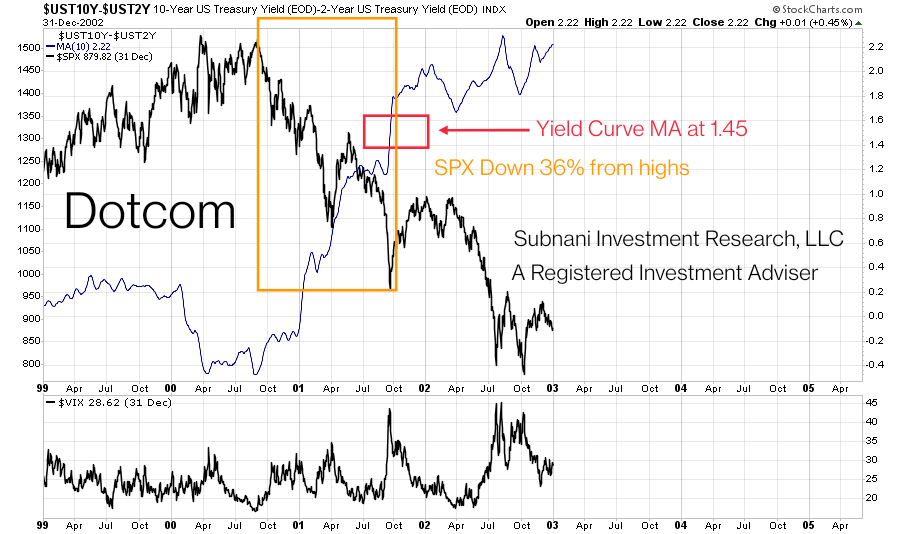
The firm noted in the article titled “Snow & Stocks: Austin ‘Snowpocalypse’ and the Looming 2021 ‘Stockpocalypse’” that the yield curve (10-year minus 2-year) moving average is suggesting the S&P 500 is due for a minimum 15-25% correction from current highs. Charts of the yield curve moving average from Dotcom, Mortgage bubble of 2008, and 2021 are provided below to zoom in on when the recessions started. The yield curve moving average is now suggesting the S&P 500 is due for a minimum 20-50% correction as the yield curve moving average has risen to 1.45 from 1.23 since the posting of “Snow & Stocks.”[11]
Dotcom Yield Curve Moving Average
Mortgage 2008 Yield Curve Moving Average

2021 Yield Curve Moving Average

‘Party Like It’s 1987?’
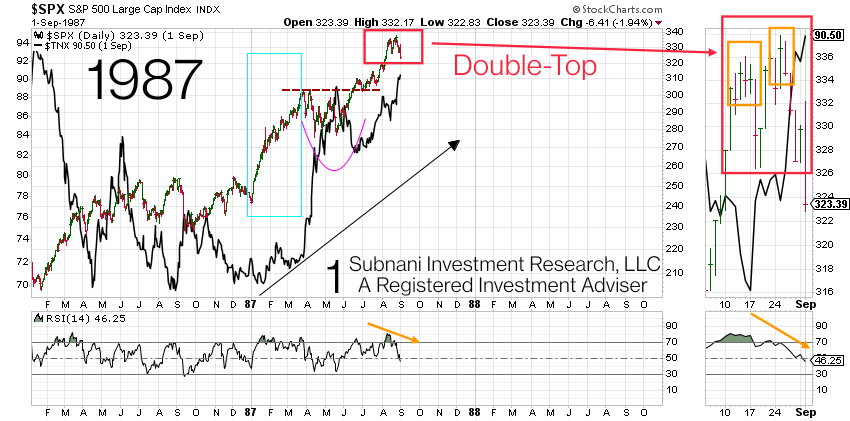
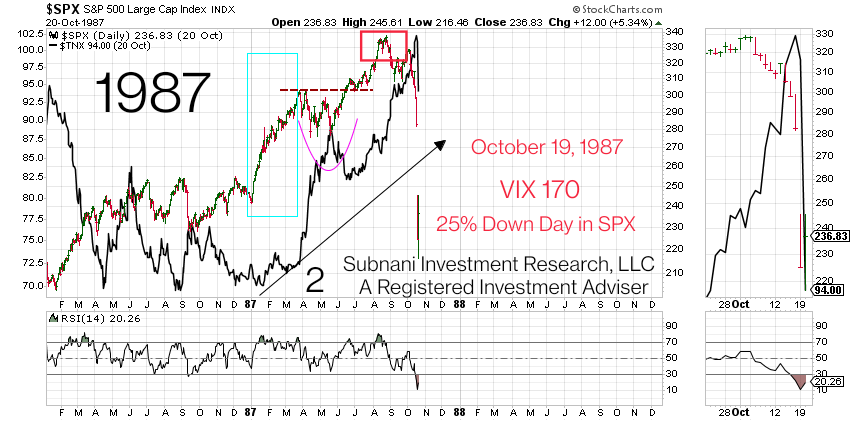
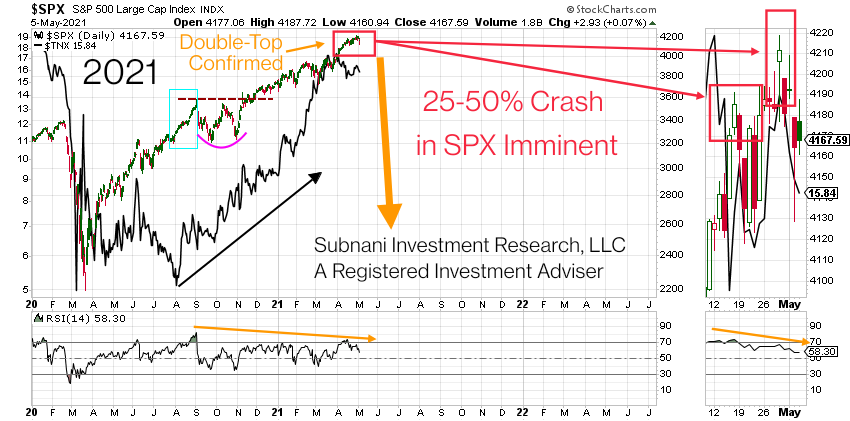
If Prince would have written his hit “1999”[12] 12 years earlier, he would have mentioned Black Monday on October 19, 1987. On Black Monday, the S&P 500 dropped approximately 20%.[13] A reverse-engineered VIX would have made a high of 150.[14] Although 2021 and 1987 are from different economic periods, the firm believes the trajectory of the 10-year interest rate (TNX) in addition to the price action of the S&P 500 from both years are nearly identical. Candlestick charts of the S&P 500 from 1987 and May 5, 2021, are provided below. In both periods, TNX is overlaid onto the chart as a black line with an upward sloping black arrow. The first rise in the S&P 500 is highlighted in a light blue box at the same time TNX bottomed and began rising. The S&P 500 pulled back for a temporary correction (purple half-circle). After breaking prior resistance (red dotted line), the S&P made a double top highlighted in the red and orange boxes. A bearish RSI divergence in the bottom subgraph denoted by the orange arrow confirms the double top candlestick pattern. The 1987 charts labeled 1 and 2 display the double top formation and the subsequent decline thereafter. The 2021 chart displays the price action of the S&P 500 as of May 5, 2021.
1987: 1
1987: 2
2021: 1
Firm Outlook
Subnani Investment Research, LLC remains bearish throughout 2021 or until the yield curve moving average has topped between 2.2-2.4. The firm anticipates the S&P 500 to decline at a minimum of 20-50% from the April 29, 2021 high of 4,218.78. The firm believes the double-top bearish pattern is confirmed and anticipates significant volatility into 2021. The firm is hedged against a crash throughout Q2 2021. The firm suggests taking profits by selling stocks, bonds, and alternative currencies or otherwise shifting out of the short dollar, short interest rate trade and into cash (create long dollar, long interest rate exposure). To become a client, contact Sanju at ssubnani@sinvestsllc.com.
References:
[1] https://www.investopedia.com/managing-wealth/modern-portfolio-theory-why-its-still-hip/
[2] https://sinvestsllc.com/the-shareholder-ownership-myth/
[3] https://sinvestsllc.com/case-study-pacific-gas-electric-nyse-pcg-stock-report/
[4] Cole, Christopher R., CFA “Volatility and the Alchemy of Risk: Reflexivity in the Shadows of Black Monday 1987.” Artemis Capital Management L.P., Oct. 2017, static1.squarespace.com/static/5581f17ee4b01f59c2b1513a/t/59ea16dbbe42d6ff1cae589f/1508513505640/Artemis_Volatility+and+the+Alchemy+of+Risk_2017.pdf.
[5] http://sinvestsllc.com/savvy/bubble-videos/
[6] https://www.federalreservehistory.org/essays/great-inflation
[7] Ryvkin, Alexander, “Volatility Products and their Uses: An Introduction to the VIX Index and Volatility Instruments” (2019). Honors College Theses. 230. https://digitalcommons.pace.edu/honorscollege_theses/230
[8] Norland, Erik. “VIX-Yield Curve: At the Door of High Volatility?” CME Group, 2 Feb. 2018, www.cmegroup.com/education/featured-reports/vix-yield-curve-cycle-at-the-door-of-high-volatility.html#.
[9] https://getyarn.io/yarn-clip/ce1822ff-6962-4521-a3c5-02db27bd85b8
[10] Norland, Erik. “VIX-Yield Curve: At the Door of High Volatility?” CME Group, 2 Feb. 2018, www.cmegroup.com/education/featured-reports/vix-yield-curve-cycle-at-the-door-of-high-volatility.html#.
[11] https://sinvestsllc.com/snow-stocks-austin-snowpocalypse-and-the-looming-2021-stockpocalypse/
[12] https://www.youtube.com/watch?v=rblt2EtFfC4
[13] https://corporatefinanceinstitute.com/resources/knowledge/trading-investing/black-monday/
[14] Cole, Christopher R., CFA “Volatility and the Alchemy of Risk: Reflexivity in the Shadows of Black Monday 1987.” Artemis Capital Management L.P., Oct. 2017, static1.squarespace.com/static/5581f17ee4b01f59c2b1513a/t/59ea16dbbe42d6ff1cae589f/1508513505640/Artemis_Volatility+and+the+Alchemy+of+Risk_2017.pdf.