A political cartoon from 2011 depicting the US economy as a train[1]
Written by Sanju Subnani
1 Lever, 2 Choices, 1 Outcome
Imagine you are the conductor of a train that is hauling a massive sum of money at high speeds. The sum onboard is $21 trillion dollars.[2] The speed of the train is traveling over 1,000 mph. The amount of money on board grows the faster the train travels. Sounds like a fun ride. People who boarded the train early are capitalizing on the growing sum and are hoping the train goes faster. Those that did not board the train are running alongside hoping to hop on. As the conductor, do you accelerate, or do you slow down to let others onboard? This is where the decision gets tricky.
The only way to control the speed of the train is by a lever. There are two choices. However, each choice poses significant risks for the people on board and the ability for the train to continue moving forward. Pushing the lever forward speeds up the train to 2,000 mph. Pulling the lever backward causes the train to come to a screeching halt. If you were to speed up to 2,000 mph, the train tracks will begin to burn apart. As a result, the train will lose its ability to stay on the tracks. If you decide to speed up, the train ultimately derails. Those chasing after the train will begin to run the other way. Those onboard will fly out of the train and ultimately lose their money. If you decide to slow down, the train will go from 1,000 mph to 0 mph within seconds. The people onboard will lose their money again as they fly out of the windows due to such an abrupt halt. Those running alongside will turn away and flee in the other direction. Choo. Choo.
“All Aboard!”
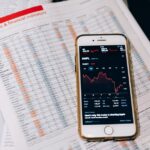
In the firm’s analogy above, the train you are controlling is the United States economy. The lever in front of you controls interest rates or borrowing costs. Pushing the lever forward keeps interest rates down and increases the speed of the train. Low borrowing costs increase economic activity by increasing the demand for goods. People looking to finance the purchase of a home, car, vacation, or fund education are more likely to take out a loan when interest rates are low. The Federal Reserve kept interest rates to the lowest level in financial history by conducting quantitative easing (QE) after the outbreak of the Coronavirus pandemic in 2020.[3] A chart showing the 10-year US government bond reaching a 200-year low of 0.50% on August 2020 is provided below.[4]
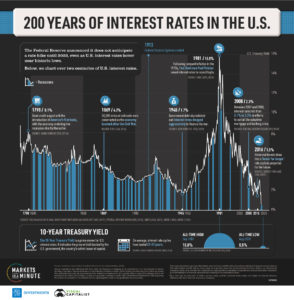
200-year history of the 10-year Treasury interest rate
With interest rates at historical lows, investors seeking higher interest rates on their cash shifted capital into stocks, bonds, real estate, gold, and digital coins. As a result, stocks, bonds, and digital coins have reached record highs. Digital coins such as Bitcoin, Ethereum, and Cardano have produced large gains in response to the Fed’s aggressive US dollar devaluation or otherwise having the throttle at max speed. Those sitting on the train are enjoying the high speeds however the tracks are beginning to melt.
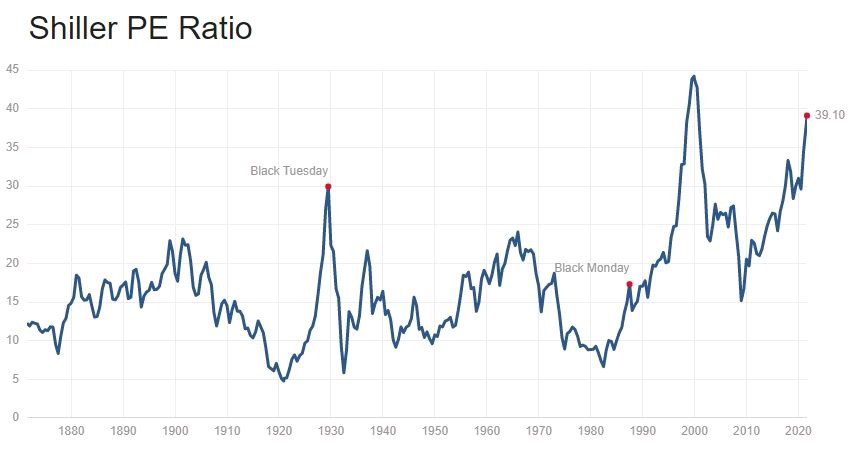
S&P 500 Case Shiller PE Ratio reaching 39. Indicating a 39 year payback from US stocks
Burn Baby Burn
In the firm’s train analogy if the train is the economy, then the tracks are the prices of goods and services. A derailment would occur when the tracks are too hot, or the prices of goods are too high otherwise known as inflation. The Consumer Price Index (CPI) measures the average change in prices for a basket of items consisting of basic food and beverages, housing costs, bedroom furniture, apparel, transportation expenses, medical care costs, recreational expenses, toys, and the costs of admissions to museums. The CPI also tracks the costs of education, communication, as well as tobacco and haircuts. The prices of goods rise when the demand outweighs the supply. When the economy shut down in 2020, the supply of goods went offline creating limited supply. As the economy begins to reopen, the demand for goods is outweighing the available supply. “The Consumer Price Index jumped by 5.4 percent since the beginning of 2021 through June, the Labor Department said on Tuesday, the largest year-over-year gain since 2008.[5] Below is a chart of CPI from 2008 – 2021.
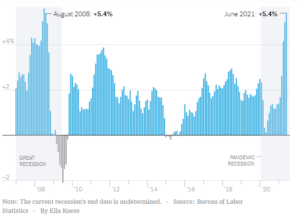
The Consumer Price Index (CPI)
“A growing chorus of observers is warning that inflation is bound to quicken. The threat has been enough to send tremors through world capitals, central banks, factories, and supermarkets. The U.S. Federal Reserve is facing new questions about when it will hike rates to stave off inflation — and the perceived political risk already threatens to upset President Joe Biden’s spending plans.[6] The Biden administration quickly pointed out that much of the move was tied to temporary supply issues: Prices for previously owned cars and trucks rocketed higher and accounted for more than a third of the increase.”[7] “You bring all of these factors in, and it’s an environment that’s ripe for significant inflation, with limited levers” for monetary authorities to pull, said David Landau, chief product officer at BluJay Solutions, a U.K.-based logistics software, and services provider.[8]
“Mattress producers to car manufacturers to aluminum foil makers are buying more material than they need to survive the breakneck speed at which demand for goods is recovering and assuage that primal fear of running out. The frenzy is pushing supply chains to the brink of seizing up. Shortages, transportation bottlenecks and price spikes are nearing the highest levels in recent memory, raising concern that a supercharged global economy will stoke inflation. Copper, iron ore, and steel. Corn, coffee, wheat, and soybeans. Lumber, semiconductors, plastic, and cardboard for packaging. The world is seemingly low on all of it. “You name it, and we have a shortage on it,” Tom Linebarger, chairman, and chief executive of engine and generator manufacturer Cummins Inc., said on a call this month. The difference between the big crunch of 2021 and past supply disruptions is the sheer magnitude of it, and the fact that there is — as far as anyone can tell — no clear end in sight.”
Europe’s largest fleet of trucks, Girteka Logistics, says there has been a struggle to find enough capacity. Monster Beverage Corp. of Corona, Calif., is dealing with an aluminum can scarcity. Hong Kong’s MOMAX Technology Ltd. is delaying the production of a new product because of a dearth of semiconductors. For anyone who thinks it’s all going to end in a few months, consider the somewhat obscure U.S. economic indicator known as the Logistics Managers’ Index. The gauge is built on a monthly survey of corporate supply chiefs that asks where they see inventory, transportation, and warehouse expenses — the three key components of managing supply chains — now and in 12 months. The current index is at its second-highest level in records dating to 2016, and the future gauge shows little respite a year from now. The index has proven unnervingly accurate in the past, matching up with actual costs about 90% of the time. To Zac Rogers, who helps compile the index as an assistant professor at Colorado State University’s College of Business, it’s a paradigm shift. “Essentially what people are telling us to expect is that it’s going to be hard to get supply up to a place where it matches demand,” Rogers said, “and because of that, we’re going to continue to see some price increases over the next 12 months.”[9]
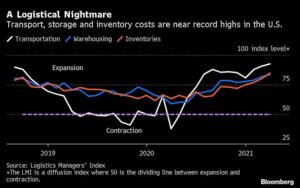
Rising transportation, storage, and inventory costs at record highs
Two Times a Charm?
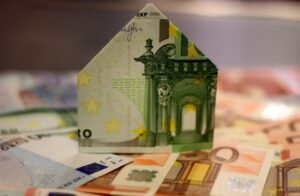
The burst of the mortgage bubble in 2007-2008 swelled initially because of excessively low-interest rates and predatory lending within the US real estate sector.[10] At that time the economic train was at max speed. “Monetary policy varied considerably over the current economic expansion that began early in 2001. Initially, it was aimed at setting the expansion in motion. To do this, the federal funds target was reduced from 5½% in March 2001 to 1% in June 2003. It remained at 1% for a year. As real estate prices soared, the train tracks began to run hot as CPI reached a high of 5.4% in August of 2008. To cool inflation, the Federal Reserve pulled the throttle backward by raising the federal funds interest rate in 17 equal increments spread over two years to 5¼%. The Federal Reserve drew attention to upward movements in the core rate of inflation at various meetings during 2006 and 2007. During the late summer of 2007, the fall in housing prices and conditions in financial markets related to the difficulty in refinancing sub-prime mortgages became a matter of concern.”[11] As a result of rising interest rates, mortgage owners defaulted on their loans causing home prices to fall. The chart below displays rate hikes by the Federal Reserve 17 consecutive times between 2004 through 2006 to tamper inflation.[12]
Interest rate hikes from 2004-2006
During the mortgage bubble, investors borrowed against their homes to invest in the stock market.[13] Once defaults began, a waterfall of selling occurred across asset classes. During 2007 – 2009, the S&P 500 fell from its high of 1550 to under 700. Below is a chart of the S&P 500 between 2007 and 2009.
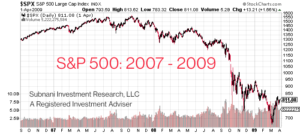
S&P 500 between 2007 – 2009
Buckle Up
Subnani Investment Research, LLC believes to lower consumer prices, the Federal Reserve may have to lower the overall demand. The firm anticipates the Federal Reserve to begin slowing the economic train down by letting interest rates rise or pulling the throttle backward. Central banks including Russia, Mexico, and Brazil have started raising their interest rates. “Emerging markets saw more interest rate hikes in June as a hawkish pivot from the U.S. Federal Reserve amplified inflationary pressures in a number of developing economies. Policymakers across a group of 37 emerging market central banks delivered a net five interest rate rises in June after a single increase in May 2021.”[14] On Wednesday, June 16th, 2021, the US Federal Reserve considerably raised its expectations for inflation this year and brought forward the time frame on when it will next raise interest rates.”[15] “South Korea’s central bank raised interest rates on Thursday, August 26th, 2021 in a decision that was expected as financial risks heat up despite the virus threat. The Bank of Korea raised its policy rate by 25 basis points to 0.75% for the first time in nearly three years, becoming the first developed economy to raise interest rates during the pandemic era. Bank of Korea Governor Lee Ju-yeol said the decision to hike rates was not unanimous, and there was a dissenting board member calling for rates to be held steady. It was also divided among analysts polled by Reuters, with only 16 out of 30 expecting the rate hike on August 26th, 2021.”[16]
A change in interest rates will change an investor’s desired return. “A high level of stock valuations means that investors have placed a greater price on a given set of expected future cash flows. But that also makes the price far more sensitive to small disappointments in expected cash flows, and to small changes in the expected returns required of investors.
For example, suppose that investors price the S&P 500 at 27 times dividends, reflecting the historical norm of a 3.7% dividend yield. How do you get 0.1% in additional long-term returns? You’ve got to drive the yield to 3.8%, which implies a price decline of (.037/.038-1=) -2.6%.
If instead investors price the S&P 500 at 74 times dividends, reflecting today’s dividend yield of 1.35%, how do you get 0.1% in additional long-term returns? You’ve got to drive the yield to 1.45%, which implies a price decline of -6.9%.
With the S&P 500 dividend yield at just 1.35%, even an increase to the very low 2% median since 2000 would imply a price decline of nearly one-third.[17] “At the current levels of corporate debt-to-GDP, if interest rates were to revert to late-2000 levels, corporate profits will drop by 1/3.”[18] The graph below depicts the current levels of corporate debt-to-GDP as of January 2021.
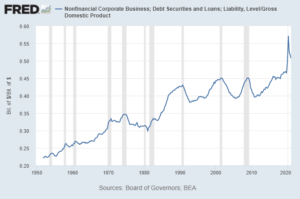
Corporate Debt-to-GDP ratio surpassing dotcom & mortgage bubble levels
Interest rates are used in stock valuation and represent the hurdle rate a company must jump over to reach net profit goals. The higher interest rates rise, the higher the company must jump to clear the hurdle to produce a net profit for stockholders. A hypothetical example of a discounted cash flow equation used in stock valuation is provided below to highlight how an increase in interest rates with no changes in the growth rate may potentially decrease stock prices:
Dividend Discount Model:
Analyst’s Stock Price = (Next Year’s Dividend) ÷ (10-year Interest Rate – Growth Rate of Dividend)
Inputs: ABC Stock
Market Price: $40
Next Year’s Estimated Annual Dividend: $1.00
10-year Interest Rate (US 10T): 4.00%
Estimated Annual Growth Rate of Dividend: 2.00% (stays the same)
Below are calculated stock prices as interest rates begin to rise:
Analyst’s stock price when 10-year rate is at 4.00% = $50
Analyst’s stock price when 10-year rate is at 5.00% = $33.33
Analyst’s stock price when 10-year rate is at 6.00% = $25
If interest rates rise, Subnani Investment Research, LLC anticipates the appetite for stocks, bonds, and digital coins to fade. Subnani Investment Research, LLC suggests taking profits in stocks, bonds, and digital coins at the current price levels. The firm is hedged against a stock market crash throughout 2021 and will extend hedges as necessary. To become a client, contact Sanju at ssubnani@sinvestsllc.com.
https://www.youtube.com/watch?v=LH-QwK4v0ZI
References:
[1] https://www.businessinsider.com/cartoons-political-crisis-2011-8
[2] https://www.investopedia.com/insights/worlds-top-economies/
[3] https://www.cnbc.com/2020/04/13/coronavirus-update-here-is-everything-the-fed-has-done-to-save-the-economy.html
[4] https://advisor.visualcapitalist.com/us-interest-rates/
[5] https://www.nytimes.com/2021/07/13/business/economy/consumer-price-index-june-2021.html
[6] https://www.ttnews.com/articles/world-economy-suddenly-running-low-everything
[7] https://www.nytimes.com/2021/07/13/business/economy/consumer-price-index-june-2021.html
[8] https://www.ttnews.com/articles/world-economy-suddenly-running-low-everything
[9] https://www.ttnews.com/articles/world-economy-suddenly-running-low-everything
[10] https://sinvestsllc.com/savvy/mortgage-meltdown/
[11] https://www.everycrsreport.com/files/20081029_98-856E_acb4451c922987f45fcb17abbfc914970d8eda17.pdf
[12] https://money.cnn.com/2006/06/29/news/economy/fed_rates/
[13] https://money.cnn.com/magazines/moneymag/moneymag_archive/2006/12/01/8395183/index.htm
[14] https://www.reuters.com/business/fed-pivot-inflation-boost-emerging-market-interest-rate-hikes-june-2021-07-06/
[15] https://www.cnbc.com/2021/06/16/fed-holds-rates-steady-but-raises-inflation-expectations-sharply-and-makes-no-mention-of-taper.html
[16] https://www.cnbc.com/2021/08/26/south-korea-hikes-interest-rates-the-first-developed-economy-to-do-so-in-pandemic-era.html
[17] https://www.hussmanfunds.com/comment/mc210808/
[18] https://www.youtube.com/watch?v=dhy9lXFIVfI&t=2065s @ 33:00; The Unholy Trinity: Volatility, Illiquidity, and Insolvency (w/Michael Green & Christopher Cole) May 25, 202