Disrupting the Curve
The biggest fear of any investor is the loss of their initial investment. Most investors are averse to risk, meaning they care about the preservation of their capital first over the returns on their capital.
Over the course of a firm’s investment horizon, there is high possibility investments will sustain unrealized losses as unexpected negative news often causes stock prices to go down. The effects of a down day on an investor’s portfolio disrupts the compounding interest curve in a way that causes the portfolio to have to work harder to gain back what it lost initially.
If you invested $100, and it lost 5%, it would be worth $95. The $95 would have to grow 5.27% to get back to $100. As illustrated in the table below, if your investment portfolio goes down by the following amount on the left, it must go up by the following amount on the right just to get back to breakeven.
| When your investment goes down this: | It must go up this to get to breakeven: |
| 5% | 5.27% |
| 10% | 11.12% |
| 15% | 17.70% |
| 20% | 25% |
| 25% | 33.34% |
| 50% | 100% |
NASDAQ (1972-1974) Hedging Example:
Hedging an investment is defined as reducing one’s losses in the event of a downturn in the stock market. A hedged portfolio holding the same stocks as an unhedged portfolio will have to work less to get back to breakeven. To illustrate the benefits of hedging, consider the following example:
From May 1972 to September 1974, the Nasdaq dropped from a high of $816 to $282, representing a 65% decline in 2 years and 4 months. Following the major decline, it took 8 years and 9 months for the Nasdaq Index to return to its initial high of $816 on June of 1983.
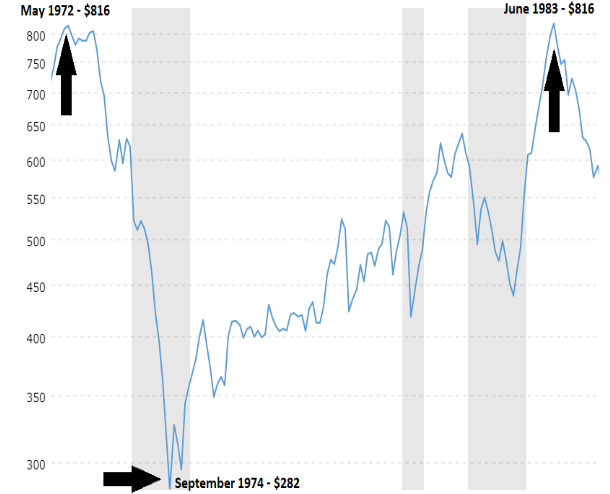
In this hypothetical example, two investors A and B each invest $100 into the Nasdaq Index at $816 on May 1972. A’s investment is unhedged without derivatives. There is no risk management in place, therefore A’s investment is entirely exposed to stock market downturns. B’s investment is hedged using derivatives. In this example index option premiums allows B’s portfolio to be partially protected from downside risk.
The chart below shows the breakdown of the unhedged and hedged investors’ portfolios after the major drop on September 1974. In this hypothetical, Investor B earned $13 in the Nasdaq’s index option premiums while Investor A had no earnings from index options.
| Investor A (Unhedged) | Investor B (Hedged) |
| Initial investment value: $100 | Initial investment value: $100 |
| Investment value on September 1974: $35 | Investment value on September 1974: $48 |
| Percent loss: 65% | Percent loss: 52% |
The Result
On June 1983, the Nasdaq Index returned to $816. In 8 years and 9 months, A’s investment is back to its initial value of $100. However, B’s investment is worth $113. B took in the $13 option premium at the beginning of the transaction. As a result, B had a higher asset base than A after the major drop. B’s investment had a gain of 13% by the time the Nasdaq came back to $816, whereas A had 0% gains.
| Investor A (Unhedged) | Investor B (Hedged) |
| Initial investment Value: $100 | Initial investment Value: $100 |
| Nasdaq Index value on June 1983: ~$816 | Nasdaq Index value on June 1983: ~$816 |
| Percent gain: 0% | Percent gain: 13% |
| Investment value on June 1983: $100 | Investment value on June 1983: $113 |
The Solution
Constantly disrupting an investor’s compounding interest curve due to random events and volatility results in lost time to compound wealth and delays the ability to efficiently grow assets.
Subnani Investment Research, LLC. provides the investing public with their expertise and services to effectively hedge portfolios.