“Bull markets are born on pessimism, grow on skepticism, mature on optimism, and die on euphoria.”
-John Templeton, founder of Templeton Funds
Bubbles, Bubbles, and More Bubbles
There is a saying the stock market is a measure of everyone’s emotions at any given time. Earnings, technology, leadership, innovation, and more recently monetary policy are believed to be the major driving forces behind asset price movement. Although these factors have changed significantly over time, human emotions have not. Our firm believes human emotion is the only driving force behind asset price movement. We assert that the US stock market is in a bubble that our firm calls “The Tech Bubble 2.0.” This paper attempts to parallel the similarities in actions from the speculative public at the peak of the Great Depression in 1929 and 2020.
As our firm outlined in the February 6, 2020 article, entitled “The Shareholder Ownership Myth” stock ownership does not equate to a physical or legal claim to a corporation’s assets, contrary to mainstream belief. The share is the intangible piece of property that the investor owns; it is not a corporation’s assets. The stock market consists of investors who over time may hold similar collective beliefs about what a share value should be and bid prices up or down. Enough investors who hold a similar collective belief and willing to pay a higher price than the previous person causes the stock market to rise significantly in price, producing a bubble. A bubble is formed when there is a disconnect between what is fundamentally correct and what investors believe to be true. Bubbles always end in a price crash when the collective belief begins to realize they are wrong, and fear begins to set in. Once fear replaces greed, the bubble bursts with great speed, and the speculative frenzy comes to an abrupt halt. Stock market bubbles have a rich history and the bubble bursting is always the same. Markets tend to be efficient and anything that appears to be “free money” is, at best, an extremely temporary displacement of market mechanics that will soon be rectified by those seeking to exploit the opportunity.[1] Below is a non-exhaustive list of market bubbles that have occurred throughout history.
- Tulip Bubble Mania in Holland (1636-1637)
- The Mississippi Company Bubble in France (1719-1721)
- The South Sea Bubble in the United Kingdom (1719-1722)
- Railway Mania in the United Kingdom (1840s)
- Bankers’ Panic in New York (1907)
- Florida Real Estate Bubble (1920s)
- Great Depression in the United States (1929)
- OPEC Oil Shock in the United States (1970s)
- Latin American Debt Crisis (1970s)
- Precious Metal Bubble (1980)
- Russian Crisis (1998)
- Dot-Com Bubble (2000)
- Global Financial Crisis (2008-2009)
- Tech Bubble 2.0? (2020)
A Bull Running on Air
The impressive US stock market bull rally from 2009-2020[2] has been running up on record amounts of corporate debt and excessive use of accounting wizardry methods such as share buybacks.[3] [4] [5] [6] A share buyback is when a corporation retires or “puts away” tradable stock reducing the shares outstanding creating the illusion of earnings growth. This technique reduces the price-to-earnings-per-share (P/E) ratio, a popular valuation metric used by retail and institutional investors to make companies appear fairly valued when they are not. A stock with a low P/E is regarded as potentially undervalued and an attractive investment (the Graham-Dodd value-investing thesis).[7] A recent study found a positive relationship between insider stock sales and share repurchases, supporting the idea that buybacks are more about managerial self-interest than shareholder value.[8]
Share buybacks have accounted for about 40% of the total earnings-per-share growth since 2009, and a remarkable 72% of the earnings growth since 2012. In fact, without share buybacks, S&P 500 earnings-per-share would experience an earnings recession growing at just around 7% since 2012 instead of 24%.[9]
To see the effect of a share buyback on a company’s earnings-per-share (EPS) and price-to-earnings-per-share (P/E) ratio, we take a look at the following example.
Suppose ABC company’s stock is currently trading at $20.
Pre-share buyback:
If ABC made $10 in earnings and had 5 tradeable shares, ABC’s earnings-per-share (EPS) and P/E would be:
EPS: $10 earnings / 5 shares = $2 EPS
P/E: $20 price / $2 EPS = 10
Post-share buyback:
If ABC decides to commence a share buyback program and retires 4 tradeable shares, ABC’s new earnings-per-share (EPS) and P/E would be:
EPS: $10 earnings / 1 share = $10 EPS, an increase of 5x the EPS
P/E: $20 price / $10 EPS = 2, a decrease of 5x in the P/E ratio
2020: A 1929 Repeat
History may not repeat itself but patterns in human behavior most certainly do. Human emotion leaves footprints in the financial markets. The similarities the collective belief had at the peak of the Great Depression bubble and currently are almost identical. We will identify the events that unfolded at the height of the 1929 bubble and what our firm believes is the top of the bubble in September 2020.
Leverage, Leverage, and More Leverage
The amount of leverage available to the small speculator was much larger in the 1920s than it is today, with some brokers requiring as little as 10% of the purchase price put down in cash to own a stock.[10] During the 1929 run-up, funds that powered the surge in stock prices came from bank loans. Until 1928, the newly created Federal Reserve poured money into commercial banks. As speculators shifted to focus on bidding up stock prices, rather than partaking in business ventures, the commercial banks began lending to financial speculation in the stock market instead of regular commercial loans. The speculative euphoria reached a point so high that U.S. President Hoover took to the media to try and talk down the frenzy. President Hoover recalled, “I sent individually for the editors and publishers of major newspapers and magazines and requested them to warn the country against speculation and the unduly high price of stocks.” At the time, a prominent economist from Yale University, Professor Irving Fisher even asserted that “stock prices are not high, and Wall Street will not experience anything in the nature of a crash.” Below is an excerpt from the media that captured the euphoria at that time.[11]
“The common stocks of this country have in the past ten years increased enormously in value because the business of the country has increased. $10,000 invested ten years ago in the common stock of General Motors would now be worth more than $1,500,000. And General Motors is only one of many first-class Industrial corporations. It may be said that this is a phenomenal increase and that conditions are going to be different in the next 10 years. That prophecy may be true, but it is not founded on experience. In my opinion, the wealth of the country is bound to increase at a very rapid rate.”
-Ladies’ Home Journal, August 1929
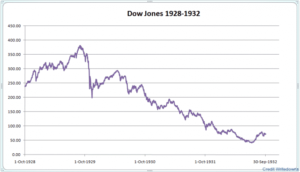
In 1929, the increase in stock prices was greatly attributed to “stock pools” in which a small group of individuals agreed to bid up the price of a particular stock. The group began to buy the stock in small quantities until the purchased quantity hit the target amount. Once the stock pool met the target quantity, members within the pool began buying and selling the stock to each other while gathering attention from the general public. The speculative public observed the increasing volume and price, assumed something positive happened under the hood, and joined in the bidding. The rising price fed off itself until it reached a massive spike. The members of the stock pool began dumping their shares on the unsuspecting public that were far out of alignment with economic reality.[12] From its peak on September 3, 1929, the Dow Jones Industrial Average fell from $386.10 to the final low of $40.60 made on July 8, 1932.[13] (See graph below)
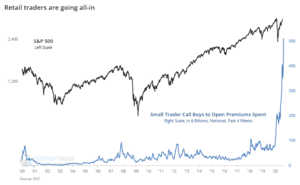
Fast forward to the present. 2020 has been an incredibly volatile year for the US stock market. News reports of a global pandemic caused the US government to institute a travel ban in January until subsequently shutting down the entire US economy in March. In late-February to mid-March the S&P 500 suffered a 36% decline in the span of just 5 weeks while the Volatility Index, “VIX” (our firm refers to the VIX as the cost to hedge) spiked from its low of $14 to $85, levels not seen since 2008 during the Global Financial Crisis. As entertainment venues and leisure facilities were shut down for months following March 2020, the stock market saw an explosion in retail speculative trading activity in single stocks and underlying options.[14] [15] An entire generation of speculators flooded into bullish positions via call options in both the top 50 and the top 500 US stocks. Data from Goldman Sachs showed that individual investors actively trading played an increased role in market volatility, particularly in select stocks. “In the shares market, 2.3% of all volume is made up of trades for $2,000 or less. The increase in small trades has been even more notable in the options market, where 13% of all trades are for 1 contract. A significant portion of this increase has been driven by higher volumes in short-dated contracts, as investors are using massive leverage to wager on near-term momentum moves in volatile stocks like Tesla.”[16]
According to a survey from E-Trade, more than half of Gen Z and millennial investors said their investment risk tolerance has grown since the shutdown began.[17] Young speculators began crowding into bankrupt companies such as Hertz as trading activity surged to levels twice that of the Dot-Com bubble.[18] [19] By July, the speculative euphoria increased rapidly as 2-3x leveraged investment vehicles designed to track mega-cap tech stocks such as Apple, Facebook, Google, and Netflix were introduced to the investing public.[20] [21] Currently, Wharton professor Jeremy Siegel made a similar prediction, as did Fisher in 1929, that the stock market will continue to rise to new highs and never experience a crash.[22]
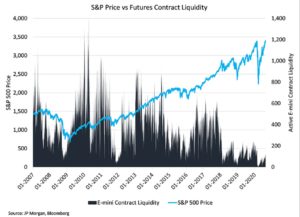
Investors today, just as they were doing in 1929, are taking loans against their paid-off homes to invest in the stock market. What was once an investment that was not supposed to be tethered to the stock market such as real estate is now instantly a price on a screen. Similar to stock pools in 1929, stock market liquidity in 2020 has been light creating the possibility for market manipulation by a few large firms. “A combination of market euphoria, free options trading, and most importantly, few market makers have sparked the fire for higher stock prices on vanishing volume.”[23] Research from Artemis Capital has shown the average number of S&P 500 e-mini contracts traded collapsed 95% from late-2017 to February-March 2018. Artemis also observed that trading only 200 E-mini futures representing just $26 million of S&P 500 index delta exposure could have caused a then-$22 trillion market to move multiple points up or down indicating extremely low liquidity and increased potential for market manipulation.[24]

The Bubble Inflates
Shortly after the 36% decline from late-Feb to mid-March, the federal government announced ‘stimulus’ checks would be transferred to the public by the US Treasury. At the same time, the Federal Reserve Bank announced it would ramp up its bond-buying program called quantitative easing, “QE.” Introduced in 2009, QE is a form of monetary policy the Federal Reserve Bank conducts to lower interest rates across all types of bonds (in this writing we use yields and interest rates interchangeably).[25] The goal of QE is to lower interest rates enough so consumers start borrowing to fund education, buy a home, start a business, etc. Upon the news of QE and stimulus checks, the stock market recovered its entire 36% decline and made a new all-time high of $3,588.11 in the S&P 500 on September 2, 2020.
The consensus on Wall Street is that the Federal Reserve is “printing money” via its QE program, devaluing the US dollar and flooding the economy with liquidity which is giving rise to inflation.[26] The consensus believes that as long as the Federal Reserve is committed to QE and interest rates on bonds keep going down then investors will rush to buy stocks as a hedge against rising inflation.[27] According to the consensus, the reason the stock market has recovered from mid-March is due to QE. Our firm believes the consensus has the narrative wrong as we explain further below.
Pop Goes the Bubble?
The Federal Reserve Act of 1913 states the Federal Reserve cannot print money and this law remains in effect today. The US Treasury is the only government entity that can print new dollar bills. QE occurs when the Federal Reserve buys bonds from commercial banks. QE is a swap of bonds for bank reserves; no new money is printed and disbursed into the economy.
Below is a simple analogy to explain how QE works:
Imagine you are at the grocery store and you notice the aisles are completely filled from top to bottom with tomato soup cans. Throughout the entire store, you see rows and rows as well as boxes of tomato soup cans. Since no one is buying cans at the moment, the price of the cans is ridiculously cheap until one shopper, the Federal Reserve, comes in and begins piling all of the tomato cans in its cart. This greatly increases the price of the tomato soup cans. The twist in QE is when the Federal Reserve goes to pay at the cashier line to check out. When the Federal Reserve goes to pay, the proceeds are credited to a reserve account that the grocery store cannot touch or withdraw from.[28]
In this analogy, the tomato soup cans are bonds of all types including short-term treasury bonds, long-term treasury bonds, corporate bonds, mortgage-backed securities, and high-yield junk bonds. The grocery store clerk selling the soup cans are the commercial banks selling bonds. Like a seesaw, as the number of soup cans decreases (the yield of a bond) the price of the soup can (bond price) increases. The Federal Reserve credits the commercial bank’s reserve account with the proceeds of the bond purchase. As a result, the commercial bank has increased reserves it may loan against and cannot buy stocks with the reserves or withdraw money. New dollars are not printed to purchase the bonds, nor taken from the existing circulation of dollars. Since the proceeds of the bond sale go into a credit account at the Federal Reserve, liquidity is not injected into the economy via the Fed’s QE program.[29]
Money is injected into the economy when commercial banks loan out that money to consumers. In a debt-based economy, increasing debt leads to increased spending. Hence, inflation only occurs when commercial bank lending is increased. As of July 2020, commercial bank lending experienced negative growth; therefore, the economy is moving into a deflationary phase as opposed to inflationary.[30] When interest rates go down the principal on loans is paid off quicker extinguishing debt. When debt is decreasing, deflation is occurring. Media articles that assert the economy is in an inflationary environment as a result of the Federal Reserve’s QE policies are simply incorrect.[31]
Our Firm’s Outlook
The consensus viewpoint regarding the intent of the Federal Reserve’s QE program leads our firm to believe that a major bubble is forming in the stock market. Armchair investors with no knowledge of the stock market other than hearing the consensus echo, “Buy the Dip” and having a “fear of missing out” are risking it all believing the Federal Reserve never fails. As a result of the genuine misunderstanding behind QE, the consensus is bearish the US dollar (DXY) which has now reached record highs similar to the late 1990s.[32] (See graph below)

During the summer months of 2020, aggressive option speculation from retail traders (traders who trade an option size of 10 contracts or less) in addition to decreasing volume in the E-mini S&P 500 futures contract caused increased market fragility and may lead to a massive spike in volatility (VIX), beyond the March high of $85, as buyers dry up and sellers come in.[33] In September the 5-day equity put/call ratio on the Chicago Board Options Exchange dropped to the lowest level in nearly 20 years which indicates a lack of investor interest in downside stock market protection and reflects extreme confidence in the Federal Reserve.[34]
Our firm anticipates the speculative fever in the stock market to come to a crashing halt by the end of 2020. Our firm has a minimum price target of 1,500 in the S&P 500, a 100 VIX, and a 100 in the US dollar. Our firm is hedged against a major crash in the stock market throughout the end of 2020.
12/28/2020 – Trade Update:
The firm’s article, “2020: The Year of Euphoria,” pointed to significant warning signals that suggest a major top in US stock markets may be forming and a crash is imminent. The firm reiterates its negative outlook and has extended its hedges into Q1 and Q2 2021.
The firm has a minimum price target of 1,500 in the S&P 500, a 100 VIX, and a 100 in the US dollar.
References:
[1] Knight, T. (2014). The Mississippi Scheme: Aftereffects. In Panic, prosperity, and progress: Five centuries of history and the markets (pp. 26-27). Hoboken (NJ), NJ: Wiley.
[2] https://www.investopedia.com/market-milestones-as-the-bull-market-turns-10-4588903
[3] https://www.cnbc.com/2019/03/25/share-buybacks-soar-to-a-record-topping-800-billion-bigger-than-a-facebook-or-exxon-mobil.html#:~:text=Markets ,Share%20buybacks%20soar%20to%20record%20%24806%20billion%20%E2%80%94%20bigger,a%20Facebook%20or%20Exxon%20Mobil&text=Share%20repurchases%20have%20seen%20four,to%20S%26P%20Dow%20Jones%20Indices.
[4] https://fortune.om/2019/08/20/stock-buybacks-debt-financed/
[5] https://www.spglobal.com/marketintelligence/en/news-insights/latest-news-headlines/share-buybacks-could-approach-record-levels-in-2020-after-2019-fell-short-57049675
[6] https://www.aboveavalon.com/notes/2020/4/23/apples-460-billion-stock-buyback
[7] https://www.investopedia.com/articles/fundamental-analysis/10/should-you-trust-pe-ratios.asp
[8] “Managerial Self-Interest and Strategic Repurchases: Evidence from Equity Vesting Schedules” by David Moore / University of Kentucky 2017
[9] Artemis Capital Management – Volatility and the Alchemy of Risk
[10] Knight, T. (2014). The Roaring Twenties: A Nation of Speculators. In Panic, prosperity, and progress: Five centuries of history and the markets (pp. 152-155). Hoboken (NJ), NJ: Wiley.
[11] Knight, T. (2014). The Great Depression: Stock Mania. In Panic, prosperity, and progress: Five centuries of history and the markets (pp. 160-165). Hoboken (NJ), NJ: Wiley.
[12] Knight, T. (2014). The Roaring Twenties: A Nation of Speculators. In Panic, prosperity, and progress: Five centuries of history and the markets (pp. 152-155). Hoboken (NJ), NJ: Wiley.
[13] Knight, T. (2014). The Great Depression: Stock Mania. In Panic, prosperity, and progress: Five centuries of history and the markets (pp. 160-165). Hoboken (NJ), NJ: Wiley.
[14] https://markets.businessinsider.com/news/stocks/gen-z-millennial-traders-taking-stock-market-risks-etrade-survey-2020-8-1029517928#
[15] https://sentimentrader.com/blog/options-traders-set-new-speculative-record–13-7-2020/
[16] https://www.zerohedge.com/markets/connecting-dots-how-softbank-made-billions-using-biggest-gamma-squeeze-history
[17] https://www.businesswire.com/news/home/20200819005336/en/
[18] https://www.ccn.com/ultra-zombie-hertz-stock-100-surge-is-a-frothy-stock-market/
[19] https://twitter.com/sentimentrader/status/1299678476950278144/photo/1
[20] https://www.etfstream.com/news/graniteshares-lists-18-leveraged-and-inverse-us-stock-etps/
[21] Ex: If Apple stock falls 5%, a 3x leveraged Apple fund would experience a 15% drop.
[22] https://www.forbes.com/sites/lawrencelight/2020/08/02/jeremy-siegel-on-why-rising-stocks-wont-peter-out/#59cfc9a71f69
[23] https://www.zerohedge.com/markets/connecting-dots-how-softbank-made-billions-using-biggest-gamma-squeeze-history
[24] Artemis Capital Management – What is Water in Markets? Volatility and the Fragility of the Medium
[25] https://www.theguardian.com/business/2009/mar/18/fed-begins-quantitative-easing
[26] https://www.fool.com/investing/2020/07/01/how-will-low-interest-rates-impact-the-stock-marke.aspx
[27] https://www.fool.com/investing/2020/04/29/the-fed-keeps-rates-near-zero-and-pledges-to-do-mo.aspx
[28] https://www.youtube.com/watch?v=Aw1MuviZkfI&t=604s
[29] https://www.youtube.com/watch?v=vC15XiaASfI&t=2420s
[30] https://www.federalreserve.gov/data/sloos/sloos-202007.htm#:~:text=The%20July%202020%20Senior%20Loan%20Officer%20Opinion%20Survey%20on%20Bank%20Lending%20Practices&text=Regarding%20loans%20to%20businesses%2C%20respondents,to%20firms%20of%20all%20sizes.
[31] https://www.fool.com/investing/2020/07/01/how-will-low-interest-rates-impact-the-stock-marke.aspx
[32] https://seekingalpha.com/article/4356484-time-to-short-u-s-dollar
[33] https://www.logicafunds.com/lets-talk-about-skew
[34] https://www.hussmanfunds.com/comment/mc200901/